Heavy traffic clogs the 101 Freeway as people leave work for the Labor Day holiday in Los Angeles. (Mark Ralston/AFP/Getty Images)
()
Support your source for local news!
In these challenging times, the need for reliable local reporting has never been greater. Put a value on the impact of our year-round coverage. Help us continue to highlight LA stories, hold the powerful accountable, and amplify community voices. Your support keeps our reporting free for all to use. Stand with us today.
Feeling like your commute is taking longer than ever?
It probably is.
Earlier this month, we took at look at which freeway in L.A. is the slowest. Hint: it's not all of them.
Now we have the stats on which freeways have gotten progressively slower over the past five years, thanks to USC's Crosstown data project.
The group of journalists and data scientists examined the average weekday rush-hour speeds on 52 freeway stretches (they call them "segments") across Los Angeles County since 2015.
Turns out 31 of our beloved roadways have gotten worse, in terms of forward momentum.
And the speeds on 11 segments dropped 5 mph or more.
5 mph, you say? That's not so bad.
Well, we hate to break it to you, but it is bad. That 5 mph actually adds up to significant time wasted in your car.
Take for example, the I-5 from Santa Clarita to Downtown. In 2015, the morning commute took roughly 46 minutes. This year, those same drivers sat in traffic for one hour.
Over a week, that's an extra 70 minutes of pain. 70 minutes!
And that's just one way.
The return trip to Santa Clarita in the evening doesn't fare much better. It now takes on average nine-and-a-half minutes longer than it did four years ago.
In one month, drivers making that round-trip commute spend roughly 7 hours and 20 minutes more time in their car than they did in 2015.
And you know what they say -- time is money, and money is a thing you need to live in this city, so that you can spend more time sitting in traffic. Yay!
THE STATS
Crosstown crunched the numbers for the average weekday rush-hour speeds from 2015-2019, during the same period: Feb. 1 - March 25.
Here's what they found:
31 freeways slowed down.
17 sped up (more on them below)
4 stayed the same.
Graphic by Crosstown L.A.
()
To see if your specific commute has gotten slower over time, scroll to the bottom of this article.
FROM THE DRIVER'S SEAT
Commuter Bob Hays knows the slowing freeways all too well. He lives in Canoga Park and makes the 32-mile commute to El Segundo four days a week. That means he drives the 101 to the 405 to the 105. (I know, we sound like an episode of SNL's The Californians).
"I've done this drive for - oh my God, almost ten years - and it's not a pretty drive," he said.
He bought his home in the valley back in 2008, so he would be fifteen minutes away from his office. Then he got a new job, and he said he wasn't willing to depart from his four-bedroom suburban home just to be closer to work.
"A house like that down in the basin would be twice the price," he said. "I couldn't afford that."
Hays has flexible work hours. When he started in 2010, he left the house at 6:30 a.m. and got to work in 45 minutes. Today, he leaves the house at 5:45 a.m., and it still takes him 45 minutes. He said if he leaves later than that, the traffic gets worse.
"I leave at 5:45. If I leave at 6, I'm spending ten more minutes on the road. If I leave at 6:30, I'm spending like half an hour more on the road. That's like 45 more minutes. And that's way earlier than most people think is reasonable for going to work."
The drive home takes him over an hour, if he leaves by 2:30 p.m. That's at least an hour and 45 minutes total in the car, per day.
Bob Hays drives the 101 to the 405 to the 105 four days a week. (Photo by Caleigh Wells/LAist)
()
Ten years into this drive, Hays has become a commuting pro. He knows which lane travels fastest when, down to the exit. He waits for big openings so he's not slowing down the person behind him and adding to congestion. He keeps a GPS on all the time, in case of rain, wildfires or car accidents.
To pass the time, he has a playlist of about 500 pre-vetted songs that he plays on shuffle every day.
"Being stuck with music I don't like for 45 minutes to an hour is not the best time," he said.
COMMUTER BLUES
Lengthening commute times are nothing new to Los Angeles. The steady decline on many routes, however, raises fresh questions about how much more of a slowdown the region can bear, and the toll it takes on the local economy.
"At what point in time is the frustration factor enough that you say, 'I'm outta here'?" asks David Schrank, a senior research scientist at the Texas A&M Transportation Institute.
Daily commutes have increased across the country by an average of eight minutes a day since 1990, according to a study by insurer Haven Life. The Census Bureau reports that as of 2017, almost 9% of Americans were "super-commuters," spending an hour or more to get to work, up from 8% in 2009.
A survey by recruiting firm Robert Half found that 23% of workers in the U.S. left a job because of an unmanageable commute.
MORE LANES, MORE PROBLEMS
Throwing money at the problem by expanding the road network rarely produces results. For proof, look no further than the Leviathan Sepulveda Pass Improvement Project on the I-405.
The $1.1 billion dig widened the highway, added a 10-mile carpool lane, and improved several on and off ramps. The work caused long-term disruption to one of the nation's busiest stretches of freeway, including two "Carmageddon" episodes, when the route was entirely closed.
From February 1-March 25 in 2015, before work had concluded, the average speed on the 4-7 pm commute heading north on the I-405 from the 10 through the Sepulveda Pass and into the Valley, was 45.9 mph.
But once the work had finished, speeds slowed dramatically. In 2016, during the same period the evening rush hour was 29.8 mph. This year, it was 27.5 mph.
To recap: that's $1.1 billion to make traffic slower.
That's why the Crosstown Project gives the Sepulveda pass a failing grade.
Hays lived through the construction and the Carmageddon episodes. When he heard the numbers, he wasn't surprised.
"It didn't make as much difference as you might think," he said. "But then it filled up. The whole problem with cars and driving is it always fills up."
He said carpool lanes encourage more lane changes. And more lane changes means everyone moves slower.
"The problem with HOV lanes is that they have to cut across the fast lane to get to the exits. I understand their value but they also really obstruct traffic."
Caltrans, the state agency that manages the freeways, says that during the construction, speeds were higher in part because of its constant messaging telling drivers to find alternate routes.
When the project was finally completed, the opposite happened: Drivers flocked to the 405, expecting, perhaps naively, for traffic to flow smoothly.
The response from transportation planners? We told you so.
"[If] you add capacity, it gets filled quickly," said Anne Brown, a professor of public planning at the University of Oregon who has studied traffic patterns in Los Angeles. "You can't build your way out of congestion. That's travel planning 101."
Eric Menjivar with CalTrans said that's why the agency has moved away from doing just that. It costs money, and it just doesn't work.
"We've gone away from just widening it just to add a general purpose lane. We're trying to get people out of their vehicles and not add to the congestion," he said. "It's just too expensive to do that."
Plus, he said, the 405 can only get so wide.
Courtesy Crosstown L.A.
()
Courtsey Crosstown L.A.
()
YOUR COMMUTE, SPED UP
But, all is not lost -- 17 of the 52 routes analyzed showed improved speeds. In some cases, that's the result of public works projects that actually made a difference.
The I-10 in the morning, coming from Pomona to Downtown, for instance, went from 44.3 mph in 2015 to 48.3 mph.
In that time, several projects, such as the completion of a carpool lane, had wrapped up, allowing for less congestion.
Schrank of Texas A&M, said that figuring out what can make a busy freeway improve is tricky. "A construction project on one corridor can have an effect on others, making it worse or better," he said.
"You have to look at all the factors around; something 10 or 20 miles away can make a difference."
A major employer moving away, or a large employer allowing people to work from home or come in on a flexible schedule, can reduce travel time for everyone on the road, he said.
Menjivar said if there are solutions to the congestion, they lie in agencies like L.A. Metro. The answer isn't more lanes and roads, it's fewer cars.
That's why there are already plans in the works to add more rail to L.A.'s commuting landscape, including in the Sepulveda Pass. But the fruition of those plans are still at least 16 years -- and a few billion dollars -- away.
As Hays nears retirement, he isn't holding out. In the meantime, he said, he's learned how to live with it.
"You have to have patience in this traffic," Hays laughed. "Or [you'll become] crazy."
SoCal's freeways speeds over time: Morning commute
Freeway
Freeway segment
Direction
2015
2019
405
405-10 to 405-110
North
30.1
24.7
210
210 intersection with 710 (Pasadena) to I-15
West
31.1
25.7
5
Santa Clarita with 10
North
46
35.3
110
Pasadena with 101
South
29
36.2
101
27 with 5
South
33.2
36.8
105
Western terminus of 105, Eastern terminus of 105
West
32.6
37.3
5
Santa Clarita with 10
South
36.4
38.3
110
101 with 105
North
31.31
39
5
5-10 with 5-405
North
28.42
39.8
10
SM with 5
West
45.8
42.2
5
5-10 with 5-405
South
54.5
43.3
605
Southern terminus of 605 to northern terminus of 605
South
47
44.2
405
118 and 405-10
South
50
45.6
10
5 with 57 and 71
West
44
48.4
101
27 with 5
North
50
48.6
110
Pasadena with 101
North
57.9
49.4
10
SM with 5
East
50.2
50.1
605
Southern terminus of 605 to northern terminus of 605
North
53.6
52.2
405
405-10 to 405-110
South
57.7
56.5
405
118 and 405-10
North
54
57.3
110
101 with 105
South
54.6
57.6
105
Western terminus of 105, Eastern terminus of 105
East
61.2
58.3
210
210 intersection with 5 to intersection with 710 (Pasadena)
East
54.8
58.4
210
210 intersection with 5 to intersection with 710 (Pasadena)
West
61.4
59.9
210
210 intersection with 710 (Pasadena) to I-15
East
61
60.4
10
5 with 57 and 71
East
63.3
62.5
SoCal's freeways speeds over time: Evening commute
Freeway
Freeway segment
Direction
2015
2019
5
5-10 with 5-405 South
South
23.1
21.5
405
118 and 405-10 North
North
45.9
27.5
405
405-10 to 405-110 South
South
31.7
28.7
105
Western terminus of 105, Eastern terminus of 105 East
East
33.9
29.4
10
SM with 5 East
East
26.6
31
110
101 with 105 South
South
37.1
33.2
210
210 intersection with 710 (Pasadena) to I-15 East
East
33.5
33.5
5
Santa Clarita with 10 North
North
40.4
34.6
10
5 with 57 and 71 East
East
40.3
35.4
101
27 with 5 North
North
36.1
38.1
10
27 with 5 South
South
38.4
38.4
110
101 with 105 North
North
39.6
38.6
5
Santa Clarita with 10 South
South
46.2
46.2
605
Southern terminus of 605 to northern terminus of 605 North
North
49.4
46.3
605
Southern terminus of 605 to northern terminus of 605 South
South
51.9
47.7
405
118 and 405-10 South
South
51.7
48
405
405-10 to 405-110 North
North
59.2
50.9
10
SM with 5 West
West
55.5
53.6
210
210 intersection with 710 (Pasadena) to I-15 West
West
49.3
53.7
110
Pasadena with 101 North
North
48.4
54.7
105
Western terminus of 105, Eastern terminus of 105 West
West
58.8
58
5
5-10 with 5-405 North
North
50.2
60.1
210
210 intersection with 5 to intersection with 710 (Pasadena) East
East
59.7
60.6
210
210 intersection with 5 to intersection with 710 (Pasadena) West
West
62.1
60.8
110
Pasadena with 101 South
South
53.7
61.4
10
5 with 57 and 71 West
West
65.9
65.2
This article was written by Caleigh Wells in conjunction with the Crosstown Project.
This story is part of Elemental: Covering Sustainability, a multimedia collaboration between Cronkite News, Arizona PBS, KJZZ, KPCC, Rocky Mountain PBS and PBS SoCal.
After San Gabriel's city council rejected the proposal as "too narrow", one city councilmember argued the entire DEI commission, created in the aftermath of George Floyd's murder, had "run its course."
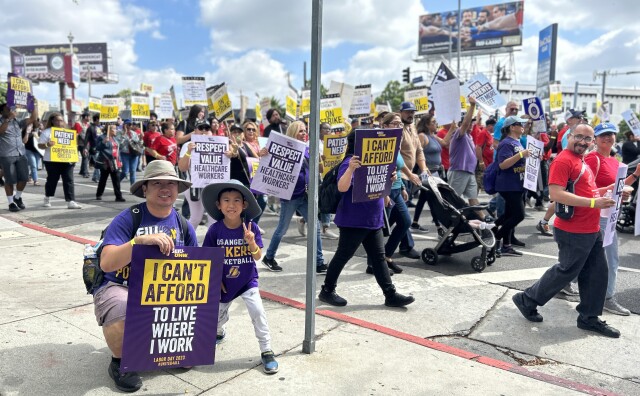
A medical industry challenge to a $25 minimum wage ordinance in one Southern California city suggests health workers statewide could face layoffs and reductions in hours and benefits under a state law set to begin phasing in in June. Some experts are skeptical, however, that it will have such effects.
The Dodgers fired Mizuhara in March after Ohtani's lawyers accused him of stealing millions of dollars from the baseball player to place bets with an Orange County-based bookie.