Next-Generation Maps
USC spatial scientists create innovative experimental maps to understand our world—and better it.
You stroll down a sidewalk in Beijing and take out your smartphone.
Using Google Maps, the most frequently used app in the world, you quickly discover you’re just minutes from the Temple of Heaven, and you continue on your way.
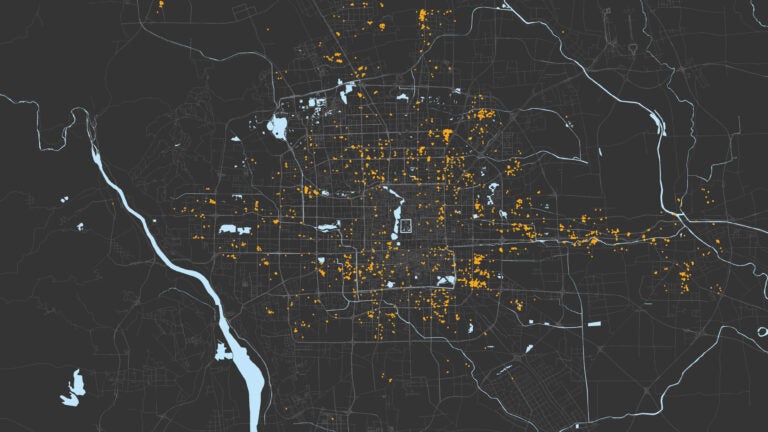
But if you’d known about a far different digital map, you could have used it to see a part of Beijing unknown to tourists: a hidden world teeming with some 1 million people, mostly migrant workers, living underground in basements and bomb shelters.
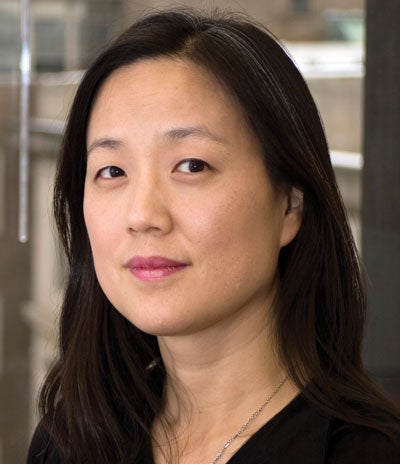
Annette Kim, an associate professor at the USC Price School of Public Policy, led a team of Chinese researchers to chart the maze of makeshift housing three stories below street level, documenting the lives of people inhabiting windowless spaces as small as 100 square feet.
Kim—who was recently recruited from the Massachusetts Institute of Technology to head USC Price’s new spatial analysis lab, SLAB—made the map after mining more than 7,000 online ads for apartment rentals. The 3,677 underground housing spaces on her digital map appear as orange dots, creating a vivid snapshot of a population that plays a crucial role in China’s economy but is often derided by some Chinese media as the “rat tribe.”
In cities around the world, Kim says, mapping can shed light on the lives of misunderstood populations such as minorities and immigrants. “In many cases, the needs of these people are not being accounted for in our future plans for the city,” she says. “The experimental maps we’re creating are helping us to see better.”
We’re light years removed from the cave etchings that served as mankind’s first maps—and even from that paperback, spiral-bound street atlas that once was a staple of every Los Angeles automobile: the Thomas Guide. Now you can find interactive maps online that can guide you to almost anything, from where to smell juniper in Rhode Island to where to find fallen fruit in your neighborhood. The carefully inked, hand-drawn maps of only 50 years ago seem like quaint relics.
“The digital age has unleashed the power of mapping,” says USC geographer John P. Wilson. Online community-based tools such as ArcGIS Online and OpenStreetMap enable practically anyone to get into the map-making game, not just cartographers or number-crunching researchers.
Thanks to the Internet, cloud computing and geographic information systems that store and process map data, Wilson says, “everyone now has the ability to collect and organize large and sophisticated data sets with all sorts of geographic information, and from that you can build maps and other kinds of visualizations.”
Witness the growth of the Spatial Sciences Institute in the USC Dornsife College of Letters, Arts and Sciences. Created only five years ago and directed by Wilson, the institute now offers more than 10 academic programs from the undergraduate to doctoral levels, a sign of how fields like geographic information science, geodesign, and spatial informatics and analytics are taking off.
At USC, students and researchers go beyond mapping for mapping’s sake: They use maps, combined with their science, to see things in different ways—and strive to make the world a better place.
“Maps can be brought to service for the public good,” says Wilson, professor of sociology, civil and environmental engineering, computer science and architecture. Some of his colleagues have examined how to build a greener Los Angeles by creating 3-D simulations of the region’s landscape from a century ago. They also documented changes in urban tree cover during the past decade using remotely sensed imagery. Others mapped links between asthma incidence and proximity to freeways and roads.
One graduate used his expertise to help the charity World Vision respond to a natural disaster in the Philippines. By combining the predicted path of 2013’s deadly Typhoon Haiyan with data about vulnerable locations, he mapped those areas of the Philippines that would most need humanitarian help. Aid packages were quickly dispensed to more than 713,000 people in 500 villages across the country.
Maps for discovery
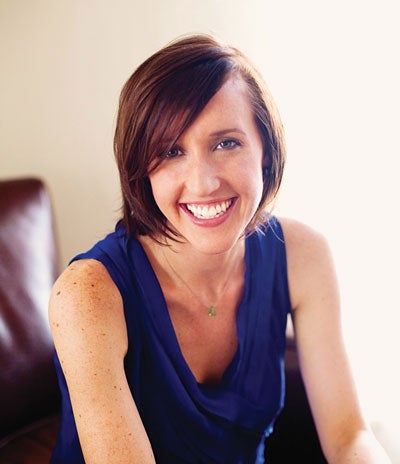
You’re at dinner at a restaurant on the Sunset Strip, and you spot actor Russell Crowe sitting 15 feet away from you. Feeling lucky? You should, based on mapping research by Elizabeth Currid-Halkett, associate professor at USC Price.
“A map is a conduit to not only organize and communicate some existing knowledge, but it also can be a conduit to go find or create new knowledge.”
John P. Wilson
Director of the Spatial Sciences Institute
Currid-Halkett painstakingly researched the socializing habits and favorite spots of Hollywood “A-listers” like Crowe by cataloguing more than 600,000 photographs of celebrities at parties, award shows and charitable appearances. Then she and a colleague ran a social networking analysis on a supercomputer to study the celebrities’ networking habits.
Surprise: The A-list celebs spend most of their time at the same places and events as other A-listers.
In other words, don’t expect an invitation to Crowe’s table anytime soon.
It may seem like an obvious Hollywood pattern, but Currid-Halkett’s research on celebrities—detailed in her book Starstruck: The Business of Celebrity—goes beyond fodder for tabloid gossip. Mapping the networking habits of people like Tom Cruise and Meryl Streep reveals the dynamics of power across society.
Scientists and Hollywood both perpetuate what sociologists call the “Matthew Effect”—the belief that success begets success, Currid-Halkett explains. Research has shown that scientists acclaimed for their early work tend to be cited by other scientists more often during the rest of their careers, regardless of the strength of their later work. It’s much like actors and the Academy Awards: Winning one opens the doors to more acting opportunities for years.
From Wall Street to Silicon Valley, most of the attention and rewards go to an elite few, Currid-Halkett says, so studying celebrity “tells us much more about human dynamics than simply about a particular industry.”
This ability to sift these patterns out of the connections between complex data and locations is what makes modern mapmaking infinitely adaptable and powerful. Maps can provide a starting point to learn more. As Wilson puts it, “A map is a conduit to not only organize and communicate some existing knowledge, but it also can be a conduit to go find or create new knowledge.”
Take faith, for example. Wilson’s group now is working with colleagues in USC’s Center for Religion and Civic Culture (CRCC) to better understand how congregations evolve over time and contribute to social capital. Their crowdsourced maps and data will illuminate patterns of religious practice in Southern California, drawing on the work of USC students who will visit places of worship and take videos and interview people of faith using a new smartphone app created at the Spatial Sciences Institute.
Wilson and his CRCC colleagues expect to learn about some surprising trends in the area, based on a few early leads.
“Most Buddhist temples are in Little Tokyo, but now most Japanese Americans live in the South Bay. I presume these temples survive because the congregation is mostly commuters,” Wilson says.
“There also are some churches that have changed from African-American to Latino and some that move frequently. We hope to better explain why and how through our research.”
Maps as stories
How do you capture the story of a city? Media artist Kristy H.A. Kang MFA ’97, PhD ’13 did it through the website “Seoul of Los Angeles,” her interactive doctoral dissertation project that documents the diverse ethnic community in LA’s Koreatown.
Kang, who serves as associate director of USC Price’s SLAB and teaches at Singapore’s Nanyang Technological University, adapted Google maps by overlaying boundary lines that tell the history of Koreatown and its people through archival pictures, videos and snippets of audio.
“The perception is that Koreatown and other different ethnic neighborhoods scattered around the city are homogeneous entities, but that’s not the case,” Kang says. For example, 58 percent of Koreatown residents are Latino, and large communities of Bangladeshis and Salvadorans settled in the area—a tidbit that users discover as they stroll through her site.
And more stories are coming. Earlier this year, Annette Kim—SLAB’s founder and director—and her colleagues began mining official city documents, such as approvals for signs like “Little Ethiopia” or “Thai Town,” to map LA’s ethnic communities. They’re using U.S. Census Bureau data too.
The efforts are all part of SLAB’s philosophy of using maps to understand the world beyond census tracts and city limits.
“It’s a way of thinking about your space differently and being able to see what you normally might overlook,” Kim says.
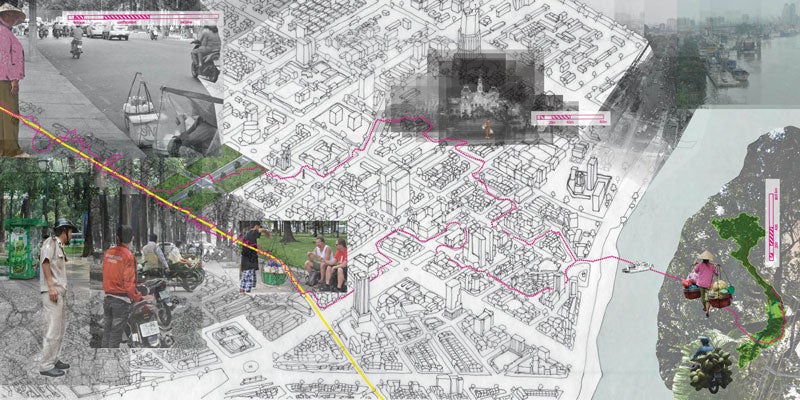
The approach comes to life in Sidewalk City, her recently published book, which chronicles the life of street vendors in Ho Chi Minh City in Vietnam. One of Kim’s maps in the project follows a coconut-water vendor for a whole day, tracing her moves around the city. Kim hoped her research would show how the city’s vibrant sidewalk life operates and encourage city planners to rethink the concept of public space.
A Vietnamese senior bureaucrat was so impressed with Kim’s research that, after meeting with her, he immediately suggested that the two of them go outside to enjoy the sidewalk life. “He seemed to be seeing everything with new eyes,” Kim says.
Planners use maps to show where buildings, roads, parks and other physical landmarks are located, Kim says, but they don’t typically incorporate people into them, especially immigrant populations. And if we can’t see them, she notes, how can we account for their needs?
Ultimately, the mapmakers aim to display the world differently so people can learn about it and make informed decisions.
“Maps afford you the opportunity to integrate everything—people, business opportunities, services, the environment, the threats and risks to business and the environment,” Wilson says. “It’s like going to see a show on Broadway and watching everything unfold on the stage. In many ways, a map can serve as a stage for life.”