
USC Viterbi computer scientists created a company that uses analytics to give basketball fans new insight into the game. (Image/Courtesy of Second Spectrum)
You call the shots on the video board, thanks to USC computer scientists
Company uses tech to pull basketball fans into the NBA game-day experience with the LA Clippers
Next time you go to Staples Center to watch a basketball game, you might be able to pick the highlights shown on the video board and see players’ stats in ways no other fans in the NBA can, thanks to two USC Viterbi School of Engineering research assistant professors.
Well, at least if you go to watch Blake Griffin, Chris Paul and the rest of the Los Angeles Clippers.
Credit Second Spectrum, a start-up company that’s the brainchild of USC computer scientists Rajiv Maheswaran and Yu-Han Chang and their partner Jeff Su, who’s teaching a new sports data science capstone class in USC Viterbi’s computer science department. Based in Los Angeles, the company uses data captured by video cameras poised on the rafters of NBA arenas to analyze the strengths and weaknesses of players across the league. The company’s work is so promising that the team took first place and $50,000 in USC Viterbi’s Maseeh Entrepreneurship Prize competition in 2013.
And when the regular season kicks off tonight, their technology will take center stage at Staples.
Highlights in high places
Anyone who has followed the recent, highly publicized tales of the Clippers’ changing team ownership knows that the organization’s new owner, Steve Ballmer, brings a love of technology with him to Los Angeles. The former CEO of Microsoft — and Trojan parent — visited Second Spectrum last month to get a demonstration of the capabilities of one of its software products that the Clippers were using.
“It was fantastic having him in the office,” Maheswaran said. “He seemed excited about everything we were doing. We have a common goal of transforming the fan experience with technology. Given his background, he really understood how hard it is to do some of the things we are doing.”
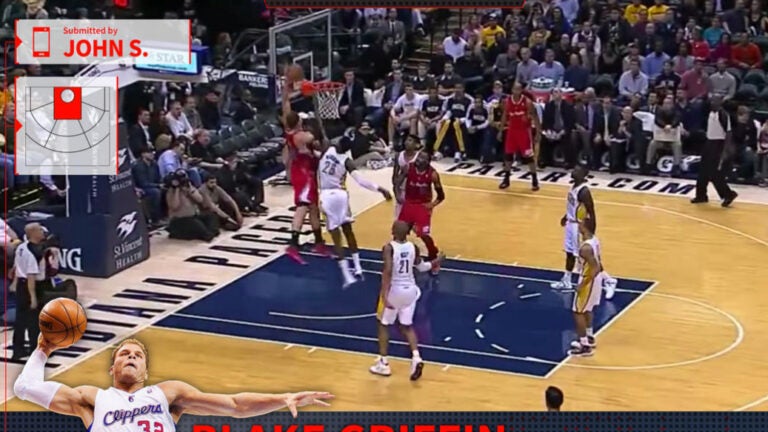
When Ballmer saw the computer scientists’ work, he was sold. For fans at the games, that will mean having a say in their game-day experience, directly from their smartphones. On their mobile screens, they’ll be able to pick from a slate of players and then pick a play they liked. One minute, they’ve selected an alley-oop pass from Paul to Griffin, the next minute, a highlight of Griffin throwing down a dunk will appear on the giant screens that hang above the floor. And the fans’ names will accompany the videos. Second Spectrum calls them Clippertron highlights — and they’re a first in the NBA.
Data geeks go wild
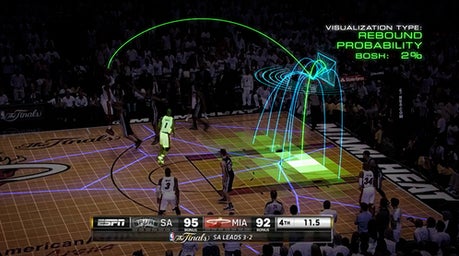
The team also is the first to use the scientists’ DataFX feature, Maheswaran said. These sequences of plays appeal to basketball fans’ inner sports geek. Using analytics from their own captured data, the computer scientists create graphics that show locations on the court where sharpshooter Jamal Crawford is particularly lethal or what the likelihood would be of the Clippers’ DeAndre Jordan grabbing a rebound or blocking a shot.
And the USC computer scientists’ interest in data visualization and analytics tools goes beyond their love of using computers and algorithms to tell a story: They’re huge basketball fans.
But their growing success has made them politically astute about their loyalties. Asked about which teams they support, Maheswaran had a wry answer: “We are fans of our seven NBA clients!”
Check out GOOD Magazine’s video on the science and engineering behind the stats:
https://www.youtube.com/watch?v=o_LXI708Yls#t=36